Showing posts with label c#. Show all posts

Friday, 9 October 2015

Getting your priorities right

I want to take a look at implementing prioritisation in redis.workflow. Currently, all workflows have the same priority; redis.workflow is all about throughput. If all tasks are going to be completed by some SLA-agreed time then it doesn’t technically matter which order everything is run in, and we can run through workflows in any order, as long as there’s no slack time in task turnover.

However, there contexts in which pure throughput isn’t enough. Sometimes its social: someone arbitrarily wants to see a graph showing a steady completion of recognizable sets of workflows. Sometimes it’s based on operational information: not all workloads are heterogeneous, and might have long-tail task duration distributions; and those long runners will breach your delivery SLA if you start them too late.  Sometimes you have combined workloads: the system might be responsible for both batch throughput calculations and ad-hoc calculations issued directly by someone who’s waiting for an answer, and wants some guarantee that they’re not wedged behind a freight train of batch work. Sometimes it’s simply SLA based: you have 24 hours worth of work, but some of it needs to be delivered by 8am, and some of it by 5pm.

In many ways then a pure throughput system might not meet all requirements, and in each of the scenarios above a decision needs to be made about each item of work: do I need to get this work done first, or that? The system needs to understand work priority.

In detail it’s also worth considering where the priority lies. Currently I’m considering prioritising workflows only relative to each other. That said it’s as easy to implement task-level prioritisation as it it to implement workflow-level prioritisation; doing the former gives me a little more flexibility, and I (or any client) could replicate workflow-level prioritisation by giving every task in a workflow the same priority.

Prioritisation itself can be simple or sophisticated, but will definitely have consequences for the structures used in redis.workflow.

Currently redis.workflow uses a queue of submitted tasks, which is fine for a simple throughput scenario. I could extend it to make practical binary priority decisions by enqueuing high priority tasks at the front of the queue, and low priority tasks at the back, without the need for a new structure.

If finer grained priorities are required then things get a little harder. If the number of levels of priority is small then having a queue per priority might be feasible; in fact, combined with the enqueue-to-front-or-back trick you only need half the number of queues as you have priority levels.

If very fine-grained or arbitrary priorities are needed, then I’d need to start thinking about maintaining relative order in the queue or list. Insertion at a given priority could happen between work of higher and lower priority, which would require iterating through the list to work out where to put it, or just enqueuing, then sorting the list. That’s likely to perform underwhelmingly; a more sophisticated solution would be to add a lookup that identifies priority boundaries by queue position.

Each of these is a reasonable way of managing prioritised work. Clearly enabling the use of arbitrary priorities would allow clients to choose, and even use simpler (say binary or even fall back to unary) prioritisation, but come at a cost in terms of complexity.

The binary high/low priority solution – enqueuing to front or back – is relatively easy to imagine in my existing code, as it’s already placing work at the back. Jumping to arbitrary priorities is harder, but it’s worth considering what would need to be done.

To manage arbitrarily prioritised work, I’d need to sort the work submitted in some way. Redis does have a sorted set, which offers O(log N) lookup and insertion by score. I’d need to be able to remove the highest-scoring task, which I would be able to do with

zremrangebyscore submitted:<type> <minPriority> <maxPriority> limit 0 1

except that there’s no limit out-of-the-box for zremrangebyscore. Instead, I’d have to use zrange to return a sorted list of items (although this sorts from lowest to highest score, meaning I need to decide whether 0 is low or high priority) then use zrem to remove the task.

I implemented this sorted-set-based prioritisation and ran it thorugh the benchmark app, giving each task the same priority. It was noticeably slower, taking about 485 seconds to run through the benchmark (a churn of about 1.8k tasks per second). Task and’ actual workflow completion seemed to keep pace with submission, but handling of the messages announcing workflow completion seems to fall behind, suggesting that it’s not scaling well in this example.

benchmark-withpriority

The benchmark needs to be extended to test workflows with varying numbers of tasks, and tasks with varying priorities.

For this moment I think that’s enough; there’s a wide range of ways of tackling the prioritisation problem, but the implementation of each is fairly straightforward in Redis. The way I’ve implemented it gives it a certain amount of flexibility – a client can configure priority at task or workflow level, but does slow things down. It’s possible the other, simpler methods have a less detrimental effect on performance; as the difference in performance is so significant it might make sense to consider making use of prioritisation configurable, although that’ll be difficult as it has fundamental consequences for the structure of the data in Redis.

Friday, 2 October 2015

Task type differentiation and looking a bit more SoA

At the moment all tasks are considered the same. If a client wanted to process only “widget painter” tasks it wouldn’t be able to, unless it pulled tasks from the queue then decided whether to process them or not. If not – there’s not much it could do, as the tasks are off the queue. It could throw them away, which isn’t very constructive.

More practically, the client could hand tasks off to components suited to dealing with them. This complicates the client architecture, as it introduces the need for a broker component that can do a fine-grained distribution of work, along with internal queuing based on task type. That can quickly become a full-blown project in itself.

To avoid the need for a broker component (but also not to obviate them entirely) it makes sense to handle this queueing of tasks by type in the workflow management domain; to advertise submission of tasks of each type using a distinct channel, and allow clients to subscribe to channels that advertise submission of tasks that they can handle. In my workflow system that means having a dedicated submitted queue for each arbitrary task type, and in turn, submission messages would need to be published on dedicated channels.

The supporting functionality would all need to become task-type aware – popping a task would involve knowing what task type to pop; pause and release would need to know which queues to place tasks back in; and so on.

Not only do we need dedicated submitted:type queues, but if we’re going to ask questions about all the submitted tasks then I’ll need a submittedTypes set just so I can locate all the submitted:type queues that are in use.

Finally; what should the task type specified be? The most straightforward immediate answer is for it to be an arbitrary string. That means we’ll be creating an arbitrary subschema of lookups that map a set of client-defined types with tasks. That looks like the beginning of a general system I have in mind that allows the client to associate any number of arbitrary properties with tasks, not just a type; but to meet this use case – allowing the client to differentiate tasks by a given type – this should be enough.

Wednesday, 30 September 2015

Handling Redis messages in parallel

In the last post it looked like the rate of submission and completion of tasks was constant in time, but that the rate of completion of workflows was not.

There are two end member scenarios: if tasks were completed in strict workflow order then there’d be a steady progression of workflows completing, giving a constant rate; alternatively, if the first 8 tasks in every workflow were completed first, and the last task only started when every other workflow had been touched, then all workflows would complete almost instantaneously right at the end of the run. What I saw in the last results might represent a balance between the two.

The workflow completion behaviour might also be controlled or modified by the messages in flight from Redis, and by the way these are both published and picked up by the client (StackExchange.Redis). I’m assuming that Redis will not stall while it passes a given message to every consumer subscribed, and I’m assuming that StackExchange.Redis will make a separately-threaded callback into my code whenever a message is received, probably subject to some throttling.

There are a couple of things there that I can check. One is the number of running tasks at each moment; if we’re handling these in a multithreaded way (via StackExchange.Redis – there’s no such behaviour in the benchmark app yet) then it should be observable. The other thing to check is the size of the submitted queue.

I added some instrumentation to my benchmark app to output these and, voila:

image

The submitted queue size reaches a plateau then hovers there, which intuitively means that across all workflows we’re finishing one task and replacing it with another in the submitted queue. It tails off roughly in line with the workflow completion curve.

One very interesting point to take away there is that the number of running tasks at any time is 1.

That indicates that somewhere the processing of tasks is either bottlenecked or significantly throttled. I’m not doing anything in my app. Is StackExchange.Redis serializing the handling of the returned messages?

It turns out that it is. By default, StackExchange.Redis forces subscribed message handling to be sequential, principally because it’s safer: it stops clients having to worry about thread conflicts when processing the messages.

However, when you want to scale out it makes sense to let go and account for possible threading issues by design. In this case, each workflow task is intended to be a unit independent of any other, and so they’re embarrassingly parallelisable. In fact, currently the creation of the multiplexer is in the hand of the client, so they can make the choice themselves.

If I set ConnectionMultiplexer.PreserveAsyncOrder = false in the benchmark app, things improve considerably. Task churn leaps to 4k per second; the whole run completes sooner (210 seconds) with the push only finishing at 168 seconds.

benchmark-2

There’s a lot less dispersion in the message handling – the workflow complete queues are much tighter, and the count of tasks completing follows the submitted count much more closely. After a suppressed start the system completes workflows at a steady rate.

For the bulk of the run task submission and completion, and workflow completion, proceed at a constant rate. That indicates that this solution might scale out with an increasing number of tasks or workflows.

It’s not all sunshine and rainbows. When repeated I’ve seen occasional timeouts which currently bring the workflows down. Superficially they seem to be correlated with the points at which Redis forks and saves out its logs – typically I see error messages like

Timeout performing EVAL, inst: 1, mgr: ExecuteSelect, err: never, queue: 22, qu: 0, qs: 22, qc: 0, wr: 0, wq: 0, in: 0, ar: 0, IOCP: (Busy=0,Free=1000,Min=4,Max=1000), WORKER: (Busy=20,Free=2027,Min=4,Max=2047), clientName: TIM-LAPTOP

This seems to indicate that 22 commands have been sent to the server (qs), but no response has been received (in); consequently it might worth increasing the timeout. If it is related to the Redis background fork-and-save, perhaps there’s something I can do there too.

Monday, 28 September 2015

First look at performance for workflow processing

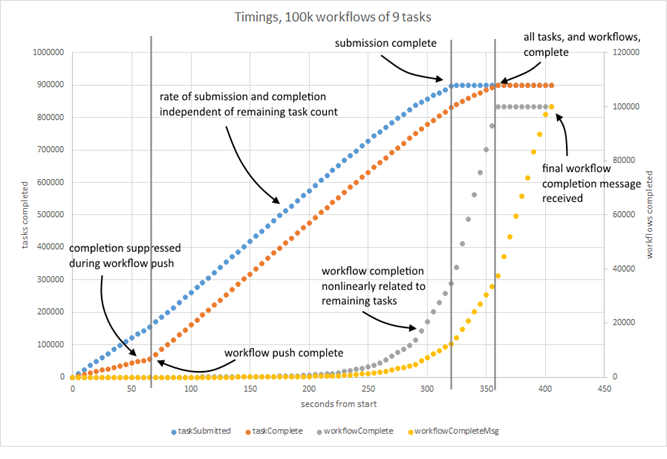
I’ve set up a simple benchmarking app to get a look at how my new Redis-based workflow processing system was going, and used it to create 100k workflows, each containing 9 tasks. The workflow structure is identical for each: just a simple chain. I ran it and a Redis instance on my dev laptop, and gathered data about task submit and completion time, and workflow completion time – both actual, and when I received the Redis pub-sub message to confirm completion.

image

It took ~350 seconds to run through 900k tasks (each as close to a no-op as possible) giving an overall churn around 1k tasks per second. It took ~60 seconds to submit 100k workflows with initial tasks, or about 1.5k workflows per second.

Completion of tasks was noticeably suppressed during workflow submission, and as a result the number of completed tasks lags behind the number of submitted tasks. However, it looks like the rate of task submission and completion – the key parts of workflow turnover – are independent of the number of tasks to run, suggesting that this behaviour scales.

There are some features that I don’t immediately understand, however. The rate of workflow completion is not linear; completion is delayed, as you might expect, but the rate increases with time.

Additionally, there’s a delay between actual workflow completion and the delivery of the message that signals that a workflow has completed. The rate of delivery looks consistent with the rate of completion, but the delay is consistently about 50 seconds. Two things immediately occur to me; as the system’s using message passing to flag submission of new tasks that they might also be affected by a delay; and that arguably we might not need to wait for a message to tell us that a workflow has completed. As I’m marking tasks complete synchronously from the client, it could potentially tell me that there are either more tasks submitted as a result, or none, in which case I could reasonably take some sort of action (although that action would need to be shared across all task handling processes, if I had such).

In fact, there’s a problem with the way I’ve labelled the curves – it’s not obvious that workflow completion time is nonlinearly related to the number of remaining tasks. I’m making an assumption.

Next things to check: I’m going to add a periodic sampling of the queue size to add to this chart, and see if its possible to analyse the number of messages being posted. 

Wednesday, 23 September 2015

Pausing for thought

This post relates to code changes in this commit to my redis workflow project on GitHub, under this issue .

In my workflow project it’s time to consider how to pause a given workflow, and the first thing is to decide on what pause actually means.

simple-fsm

At first sight it means “hold everything that’s running” and “stop anything new from starting”, but that turns out to be difficult to implement effectively generally, and has some particular wrinkles when using Redis.

It looks easy to stop anything new from starting: I can move all tasks for a given workflow to a state that means they won’t get picked up; let’s say that state is labelled paused, because frankly, this gets complicated enough. To release the tasks all I’ll need to do is move all the paused tasks for this workflow back to the submitted state.

Except: the fact I’m asking for all the submitted (or paused) tasks for a specific workflow means we have a decision to make. At the point of time this functionality was added all these tasks were together in a global submitted state. I could loop through every id in the submitted set, use those ids to lookup tasks and fetch their workflow ids, then decide whether each one needs to be acted on.

Alternatively I could populate an additional set when tasks transition to each new state, keyed by workflow id. When tasks in workflow 1 move to the submitted state, for example, we could add them to a distinct set with key submitted:1. That makes finding tasks in a specific state for a specific workflow much easier, and is the approach I’m taking. It means S x W new sets at worst, where S is the number of states and W the number of workflows. At the scale I’m aiming for that means ~600,000 sets, assuming no clean-up after workflows.

So, when someone asks to pause a workflow we’ll just shift all tasks from submitted state to paused, yes? And on release, we should just move everything from paused to submitted? Not quite.

I’m deciding to let running tasks run to completion. As currently running tasks complete (or fail) they might cause further tasks to be submitted, which isn’t the behaviour we want. It makes sense then to have the completion logic know that if the completed task has moved to the paused state then it shouldn’t cause its dependencies to be submitted, although it can be transitioned to is final desired end state (complete, or failed).

However, when it comes to releasing the workflow again, what should happen to the children of those completed tasks, if all their parents have completed? If I don’t do something then they won’t get picked up when someone asks to release the workflow – there’s nothing left to complete and trigger their submission.

Instead, if a paused task completes and its children become eligible for submission they should be placed in the paused state themselves. Then, when someone requests that the workflow be released, they’ll shift back to the submitted state.

On release, then, that takes care of ensuring I don’t lose track of any tasks, assuming that the release command comes after all outstanding running tasks have completed.

If the release request comes while tasks are still running down, however, releasing the workflow  will be difficult. We won’t know whether to move the tasks to the submitted or running state, because there’s no differentiation in source state for tasks in the paused set. We’ve lost that information. If we shift a task that’s being executed somewhere to the submitted state on release then it might get run twice in parallel, or get confused when it comes to submit and finds it’s not in an expected state.

20150917_001111

The (hopefully) final puzzle piece is then to record the last state of each task, so when a release request is issued we can move it back to the appropriate state. Running tasks should get moved back to running, submitted tasks to submitted. Tasks that have completed already won’t be in the paused state, so won’t get considered for release, and we’ll need to tag newly runnable tasks with a fake last state of submitted.

chart

That should means we don’t lose any information about the state of the workflow during pause and release operations. For such a simple thing it’s still quite possible to get wrong; making a few assumptions and decisions explicitly helps a great deal. I decided to:

1. Stop anything new from starting.

2. Let executing tasks run to completion.

3. Create lookups to answer specific questions.

4. Avoid duplicate task execution.

all of which seem reasonable currently; let’s see how the next chunk of functionality changes that.

Friday, 11 September 2015

Picking up where you left off

One thing is certain in any live system: something will break and leave the system in an inconsistent state. If your system isn’t designed with this as a core assumption – not that things will work, but that things will break – then your design is wrong.

Less catastrophically, there are occasions where you want to turn part or all of a system off. Without thought this will have the same effect: the system will be left in an inconsistent state.

In a distributed workflow this generally means that tasks are unofficially abandoned, as the agent responsible for running them can’t complete them and update their state. If a system is deliberately stopped then you have a chance to manage that state properly. You could:

  1. wait for all running tasks to complete before stopping the system, while preventing any new tasks from running, or
  2. transition any running tasks to an appropriate pre-running state.

Typically any final solution comprises some element of the second plan; under the first plan you might still want to be careful about giving tasks a maximum timeout duration, and if tasks reach that timeout then you have no option but to reset them to a pre-running state.

If your tasks define work that’s to be undertaken on a separate system – say a distinct compute cloud – then resetting tasks you might still have some underlying problems to solve if that compute infrastructure doesn’t allow you to cancel running work.

In each case, however, you have a chance to transition tasks to some desired state before agents stop. If an agent has failed you typically don’t get that chance, and you need to find some other way of managing the state. There are a few options for doing that, among them:

  1. just forget; have some backstop process gather up tasks that haven’t had a state update within a certain duration and automatically reset them to a pre-running state, or
  2. make it possible for agents to reconnect to their previous state and decide what to do with abandoned tasks.

The first option there is quite simple, but has implicit problems. How do you choose the duration after which task state gets reset? You run this risk of either resetting in-flight tasks, or leaving tasks abandoned for so long that their results are no longer required. At worst, this backstop is a manual process.

The second presents more explicit problems: how does the system know which state is or was associated with which agent? Two things are needed: first each agent needs to have an identity that’s maintained in time (or at any time there needs to be an agent that’s acting under a given identity), and second that identity needs to be associated with task state when it takes responsibility for it, and dissociated when it gives up responsibility – when it starts and stops the task.

Maintaining a system of agents with distinct identities is relatively straightforward. The trick is to have any new agent process assume one from a pool of identities when it starts up. The actual technique chosen is heavily influenced by the mechanism you use to manage agent processes, but could be as simple as an argument passed in on a command line – “you are agent 1, the first thing you need to do is work out what the last agent 1 was doing”.

Associating an identity with task state is a little more complicated, as there are some options for where that association state could sit. It could be stored locally by the agent; every time it takes a task, it adds the tasks identifier to its local store. If another agent takes its place, it can use that stored task state to reconnect with what was running. Alternatively, it could be stored alongside the task state in whatever state store’s being used.

In each case information from one domain is leaking into another as responsibility is taken and given up for task state. The important thing is to notice that an exchange of information is taking place – when a task is taken, task data is being exchanged for the an agent identity – and that that exchange must happen in a transactional manner so that information isn’t lost.

For example – an agent could pop a task from the task state store, and then store that task information in a local sqllite database. If the agent dies between popping the task and storing the data in a local database then information is completely lost.

That’s bad, and something to be avoided.

If the agent presents its identity information to the state store as part of the task pop process however, the state store can associate that identity with the now-running task as part of the same transaction –- safely.

The latter approach is what I’ve taken with the workflows-on-Redis project I’ve been working on recently in order to enable the recovery of tasks, and ensure that none of that information is lost when taking tasks in the first place.

Tuesday, 24 February 2015

Loading SOS in windbg. Why is it never quite as easy as you hope it’ll be?

I started analysing a production crash dump at my desk, with a set of libraries that don’t match those installed on the production server. Typically windbg would complain:

> !clrstack
The version of SOS does not match the version of CLR you are debugging.  Please
load the matching version of SOS for the version of CLR you are debugging.
CLR Version: 4.0.30319.1026
SOS Version: 4.0.30319.18444
Failed to load data access DLL, 0x80004005
Verify that 1) you have a recent build of the debugger (6.2.14 or newer)
            2) the file mscordacwks.dll that matches your version of clr.dll is 
                in the version directory or on the symbol path
            3) or, if you are debugging a dump file, verify that the file 
                mscordacwks___.dll is on your symbol path.
            4) you are debugging on supported cross platform architecture as 
                the dump file. For example, an ARM dump file must be debugged
                on an X86 or an ARM machine; an AMD64 dump file must be
                debugged on an AMD64 machine.
 
You can also run the debugger command .cordll to control the debugger's
load of mscordacwks.dll.  .cordll -ve -u -l will do a verbose reload.
If that succeeds, the SOS command should work on retry.
 
If you are debugging a minidump, you need to make sure that your executable
path is pointing to clr.dll as well.

The first step is to get hold of the correct libraries from the server:

cp \\server\c$\windows\microsoft.net\Framework64\v4.0.30319\sos.dll c:\temp
cp \\server\c$\windows\microsoft.net\Framework64\v4.0.30319\mscordacwks.dll c:\temp
cp \\server\c$\windows\microsoft.net\Framework64\v4.0.30319\clr.dll c:\temp

In theory at that point, I should just be able to run

> .load c:\temp\sos.dll
> !clrstack

but sadly still no joy. If I run

> .chain

it tells me that it knows about more than one version of SOS

…
Extension DLL chain:
    C:\Windows\Microsoft.NET\Framework64\v4.0.30319\sos: image 4.0.30319.18444, API 1.0.0, built Wed Oct 30 21:40:20 2013
        [path: C:\Windows\Microsoft.NET\Framework64\v4.0.30319\sos.dll]
    c:\temp\sos.dll: image 4.0.30319.1026, API 1.0.0, built Thu Jul 03 07:58:50 2014
        [path: c:\temp\sos.dll]
…

I can unload the non-useful one

> .unload C:\Windows\Microsoft.NET\Framework64\v4.0.30319\sos

and then run SOS commands happily.

Saturday, 9 March 2013

Unable to load type because it is not public. Except, it is.

TL;DR: if you create constructors for new types derived from ConfigurationSection, you need to create a default constructor too.

While working on some C# configuration I hit this error at runtime:

System.Configuration.ConfigurationErrorsException : An error occurred creating the configuration section handler for databaseSources: Unable to load type 'Sources.SqlServerDataSourceConfiguration, Sources, Version=1.0.0.0, Culture=neutral, PublicKeyToken=null' because it is not public. (C:\Users\Tim\Documents\Code\csharp\Alembic.Metrics\bin\Debug\MetricAgent.exe.config line 7)
  ----> System.TypeLoadException : Unable to load type 'Sources.SqlServerDataSourceConfiguration, Sources, Version=1.0.0.0, Culture=neutral, PublicKeyToken=null' because it is not public.

Confusing, as the code looks like:

public class SqlServerDataSourceConfiguration : ConfigurationSection
{
    public SqlServerDataSourceConfiguration(IEnumerable configs)
    {
        Databases.Add(configs);
    }

    [ConfigurationProperty("databases")]
    public DatabaseElementCollection Databases
    {
        get { return (DatabaseElementCollection)base["databases"]; }
    }
}

And, out of paranoia, ILDasm tells me:

.class public auto ansi beforefieldinit Sources.SqlServerDataSourceConfiguration
extends [System.Configuration]System.Configuration.ConfigurationSection

So, what? Instinct told me it’ll need a public default constructor. Added one and bingo; problem gone.

And soon, I hope I’ll figure out why.

Friday, 15 February 2013

Logging and context in distributed systems

Garry Shutler posted about logging at the end of last year; at the same time I was thinking about some structures that my friend Chris Oldwood had put in place to enrich our logging with contextual information. Gary’s intent was to demonstrate that good logging is a vital part of a distributed system; his example mechanism for relating log messages was necessarily simple, and I’d like to expand it.

“Given sufficient detail in your logs,” Garry says, “you no longer have to theorise or piece together how something happened. Your logs will lay it out for you, plain as day.

Anyone with production experience of a distributed system is likely to agree. If you can identify and tie together related log entries over thread and process boundaries then working out what actually happened becomes possible. An important first step is to have process and thread ids in every log message; the alternative is chaos.

Moreover, it’s not just about stack traces; to replicate a problem you often need to understand the path to failure, and that’s where contextual information helps.

Enriching logs with contextual information

Garry’s simplified example has him manually inserting a username into each log entry, allowing him to tag those entries caused by each user’s actions. This is a not so practical in larger-scale system; in such systems we want contextual information to be tagged automatically onto log messages, and we want to be able to arbitrarily extend that contextual information as we see fit. We can do that with a Diagnostic Context, described in Pattern Languages of Program Design Vol. 3.

Diagnostic contexts are essentially maps associated with a logging subsystem. Developers can place whatever they want into the diagnostic context, and the logging subsystem picks it up and tags log messages with it.

At coarsest grain we want a key piece of information carried from one thread to another – like a session id – that allows you to tie related messages together. At finer grain we might want to signal transition through system layers; or the creation of important contextual information like authorisation for a specific user; or the start and end of significant independent workflows.

As crossing boundaries generally implies marshalling this map in some way, especially in service-oriented architectures, then using a single piece of tie information on either side of the boundary is more efficient than simply reconstituting the entire map.

Log4J has both Nested and MappedDiagnosticContexts. Nested contexts are not map-based but instead allow you to push and pop new context strings onto and from a stack. Mapped contexts do not give you this stack-like behaviour – a push of a new value for an already-defined parameter overrides it. In both cases the context can be inherited from a parent thread but you must clone the entire current context and use the clone to create a new context for the new thread.

Log4Net has a GlobalContext which has stack semantics, and allows the attribution of values to named parameters. It similarly makes use of the Dispose pattern and using { } syntax to make management of contexts simpler.

The team I’m currently with has a home-grown Diagnostic context called Causality which bears a deal of similarity to log4net’s GlobalContext.

A simple C# Diagnostic Context

The team I’m currently with has a diagnostic context called Causality. Causality is plumbed into our logging subsystem. If you’re using an off-the-shelf logger that doesn’t support diagnostic contexts you can just decorate your logger invocations with methods that append information from Causality.

Causality is essentially a thread static map. For convenience it's structured as a set of transactions so that attributes can be updated and reverted rather than just overwritten. A single Transaction represents a change to a single Attribute-Value pair, and the Dispose pattern is hijacked to provide some syntactic sugar:

private sealed class Transaction
{
    public Transaction(Attribute attribute, Value @value)
    {
        // instantiate _attributes map if needed and add key-value pair ...
        // if this is an update of an existing Attribute then store the old
    }

    public Dispose()
    {
        // rollback the attribute if it was modified ...
        // or just remove it if it was new
    }

    [ThreadStatic]
    private readonly static Dictionary<string, string> _attributes;
}

As _attributes is private readonly ThreadStatic it’s safe to use without locking in concurrent operations.

A CompoundTransaction extends this, representing a stack of Transactions that is unwound on Dispose. The CompoundTransaction just provides a simple way of updating the context with a set of Attribute-Value pairs.

Labelling the context -- or appending/updating an Attribute -- is then the creation of a Transaction:

public static IDisposable Label(Attribute attribute, Value @value)
{
    // instantiate a transaction ...

    return transaction;
}

which would be used within a using block:

Log.Info("I'm about to do something ...");
using(Causality.Label(Category.System, "User", "timbarrass")
{
    Log.Info("I'm doing something!"); 
}

Log.Info("I've done something.");

Causality also provides a Format or ToString method that flattens the map to a string representation. Assuming that Log.Info or the logging subsystem uses this method, the result of the code above might look like:

2013-01-22 07:34 INFO 3432 1 I'm about to do something ...
2013-01-22 07:34 INFO 3432 1 I'm doing something! [User=timbarrass]
2013-01-22 07:34 INFO 3432 1 I've done something.

The Transaction holds attributes at thread static scope, which means that the attributes won’t be available when you cross a thread or other boundary. On the other side of the boundary you need to reconstitute Causality with a key piece of information that can tie the two threads together. On the first thread:

Causality.IdentifyPrimaryCausality("Request");

using(Causality.Label("User", "timbarrass"))
using(Causality.Label("Request", "31415))
{
    Attributes causality = Causality.AcquirePrimaryCausality();

    Log.Info("Creating worker thread.");

    var worker = new Worker();
    ThreadPool.Start(worker, causality);

    Log.Info("Worker started.");
}

and on the other side of the thread boundary:

public class Worker
{
    public void Start(object state)
    {
        Causality.InjectPrimaryCausality(state as Attributes);

        using(Causality.Label("Component", "Worker")
        {
            Log.Info("Starting work.");
        }
    }
}

The logs here might look like:

2013-01-22 07:34 INFO 3432 1 Creating worker thread. [User=timbarrass;Request=31415]
2013-01-22 07:34 INFO 3432 2 Starting work. [Request=31415]
2013-01-22 07:34 INFO 3432 1 Worker started, [User=timbarrass;Request=31415]

Friday, 5 October 2012

Boolean logic and WaitHandles

I had a fun five minutes today trying to express a wait on three WaitHandles X, Y and Z in which I want both of X and Y to be signalled, but have Z as an early escape. It’s soon clear that you can’t express:

(X && Y) || Z

With WaitAll and WaitOne, e.g. as

WaitHandle.WaitAll{ X, Y } || Z.WaitOne

because WaitAll blocks.

Thanks to the fact that boolean operations are distributive I can recompose (X && Y) || Z as

(X || Z) && (Y || Z)

and apply that structure in this case as

WaitHandle.WaitAny{ X, Z } && WaitHandle.WaitAny{ Y, Z }

with the proviso that the state of Z is unchanged by the Wait – for example, as long as Z does not autoreset.

My particular example was in managing a task workflow – the kind of thing that’s (almost certainly) made redundant by the TPL in .NET 4+. In my case, X and Y are a throttle on in-flight tasks, and a turnstile that admits workers when tasks are newly runnable. Z is an early escape in case of shutdown or exception.

I’m hoping that some clever bod will spot this and point out there’s a perfectly natural and convenient way of expressing this more simply.

Caught between declarative and programmatic custom configuration element methods

I don’t need to create custom configuration sections for .NET apps very often; whenever I do, it seems like an awkward process.

I hit a new problem recently; only a small one, but sufficiently frustrating that I need to commit it to memory. I was mixing up the two distinct methods for creating the configuration: programmatic, and declarative (or attributed).

The symptom was a  “key has already been added” exception when loading a new application’s configuration. The exception was thrown by configuration elements added to a custom ConfigurationElementCollection.

The error seemed clear: I’d already added a config item with this key. So how do I define the key for an item? Figuring it’d be easy I leant on Intellisense, found the IsKey attribute and thought – great! I can define the properties that make up the key. Happily, I added key properties to my derived ConfigurationElement, suitably attributed.

Daft.

It didn’t work, and it took me a little while to figure out what was going on. I’d forgotten that the ConfigurationElementCollection acts as a factory of sorts – and is also given the responsibility of generating the key. I’d filled out some simple placeholder code to generate an element key there which clearly wasn’t up to the task.

It was only after that, when I looked more deeply into the ConfigurationElementCollection that I realised I’d been mixing mechanisms for expressing the custom configuration. The IsKey attribute was irrelevant, as the mechanism I was using to generate the collection was programmatic.

So, multiple lessons learned: don’t lean on Intellisense without reading the docs; think about the structure of your data, even if it’s a configuration element; and don’t add placeholder code for functions like key generation.

Thursday, 20 September 2012

Paint dries, kettles boil, threads block; waiting can be hard to do

Today I added a simple wait-then-retry mechanism to a piece of code that occasionally bites my current client. The existing code tried an action and just dumped out if an exception was thrown. In this case, some of the thrown exceptions weren’t fatal -- the command could be retried in a short while (it’s actually an attempt to update a database under transient load).

At first I implemented the wait-before-retry simply, with a deliberate trade-off between complexity and accuracy – as a series of Thread.Sleep steps, so that after each step the thread could yield to another. It looked a little like this:

class ActWithSimpleRetry
{
    private int _allowedAttempts;

    private int _delay;

    private Action _customAction;

    public ActWithSimpleRetry(int allowedAttempts, int delay, Action customAction)
    {
        _allowedAttempts = allowedAttempts;
        _delay = delay;
        _customAction = customAction;
    }

    public void Run()
    {
        var attempt = 0;

        while(attempt++ < _allowedAttempts)
        {
            try
            {
                // _customAction should throw a CustomException to simulate 
                // the behaviour I wanted to retry on.
                _customAction();

                return;
            }
            catch (CustomException)
            {
                if (attempt == _allowedAttempts) throw;
            }

            YieldingWait(_delay);
        }
    }

    private void YieldingWait(int delay)
    {
        var elapsed = 0;
        var step = 500;

        delay = 1000 * delay;

        while(elapsed < delay)
        {
            System.Threading.Thread.Sleep(step);

            elapsed += step;
        }
    }
}

There we go, professional job done. Looks like I’ve thought about it, it’s not just sat there blocking the thread for delay milliseconds. But hang on: do I even need to yield?

Constructing the wait like this is more complex than it need be: a single Thread.Sleep would do, as I’m not worried about freezing a UI; I’m not checking on “Cancelled” state; and I’m not waiting before synchronizing threads.

If I had been worried about synchronizing threads then this implementation would be clunky, leading me to poll on some shared state. Moreover, the waiting thread could always yield to another, and it might be a while before the waiting thread is able to execute its next wait step. The way I had implemented the wait – with no reference to actual time elapsed – is naive.

A simple Thread.Sleep would be a more honest solution to the problem.

What about situations where you do want to worry about timing accuracy and thread freezing – and coordinating with a cancellation signal on another thread? The alternative is to use a Timer running independently of the main thread. A first attempt might look like this:

public void Run()
{
    var attempt = 0;
    var timerEvent = new EventWaitHandle(true, EventResetMode.AutoReset);

    var timer = new System.Timers.Timer(_delay * 1000);
    timer.Elapsed += (sender, args) => timerEvent.Set();

    while (attempt++ < _allowedAttempts && timerEvent.WaitOne())
    {
        try
        {
            _customAction();

            return;
        }
        catch (CustomException)
        {
            if (attempt == _allowedAttempts) throw;
        }

        timer.Start();
    }
}

The Timer is created with the desired wait, and configured to signal a WaitHandle on expiry. The main thread then Waits on that handle (and checks the number of attempts) before trying again.

Here I’ve gained some control over the duration of the wait at the cost of some complexity. However – I’m still blocking on the main thread at timerEvent.WaitOne! If I want to entertain the possibility of a clean shutdown, I’ll need to also take a look at waiting on a cancellation signal. That would look something like this:

public void Run()
{
    var attempt = 0;
    var timerEvent = new EventWaitHandle(true, EventResetMode.AutoReset);
    
    // in practice this would be a member field that could be Set
    // from a separate "cancellation" thread
    var cancelEvent = new EventWaitHandle(false, EventResetMode.ManualReset);

    var timer = new System.Timers.Timer(_delay * 1000);
    timer.Elapsed += (sender, args) => timerEvent.Set();

    while (attempt++ < _allowedAttempts && WaitOnSignals(timerEvent, cancelEvent))
    {
        try
        {
            _customAction();

            return;
        }
        catch (CustomException)
        {
            if (attempt == _allowedAttempts) throw;
        }

        timer.Start();
    }

    // handle the drop through here; probably a cancellation
}

private bool WaitOnSignals(WaitHandle timer, WaitHandle cancel)
{
    var handleActions = new[]
        {
            new { Handle = cancel, Result = false },
            new { Handle = timer,  Result = true  },
        };

    var handles = handleActions.Select(x => x.Handle).ToArray();

    int signalled = WaitHandle.WaitAny(handles);

    return handleActions[signalled].Result;
}

Which is better (and reminds me that Chris Oldwood is always reminding me to wait on two events, not one): it’ll break out of the processing if there’s a cancellation. However, it still blocks at WaitHandle.WaitAny. If, finally, I want to yield to other threads periodically then I’ll have to break out of the wait periodically:

private bool WaitOnSignals(WaitHandle timer, WaitHandle cancel)
{
    var handleActions = new[]
        {
            new { Handle = cancel, Result = false },
            new { Handle = timer,  Result = true  },
        };

    int signalled;
    var handles = handleActions.Select(x => x.Handle).ToArray();

    while((signalled = WaitHandle.WaitAny(handles, 10)) == WaitHandle.WaitTimeout)
    {
    }

    return handleActions[signalled].Result;
}

Finally, here I get actual elapsed time before the timer expires and allows work to continue, and can avoid blocking on the timer wait by using Waithandle.WaitAny to automatically handle both timer and cancellation signals. There is a risk that it won’t react to a cancellation or complete signal as soon as possible because it yields control after 10 milliseconds – but if you want to allow other threads a look-in you have to accept that they’ll take some processing time, and that on top of the time taken for context switches.

Bearing in mind the added complexity of this wait and the loose restrictions around thread freezing and cancellation for the original app – I’d be sorely tempted to go for a simple, honest Thread.Sleep instead.

Friday, 13 April 2012

C# performance counters impact performance? No, but it seems that Chart.SaveImage does.

A little thought later and it looks like no, they don’t impact performance. What I was seeing was the effect of prepping and drawing a chart – on about the same timescale that I was querying for information.

Diagnosing the problem was straightforward; I crosschecked the processor usage for the tool with perfmon. After configuring it to avoid saving down a chart the processor usage dropped to zero.

It is a good example of misleading yourself while looking at performance stats. I could see usage spiking on a period that looked suspicious. I used the VS 2010 in-built profiler and saw that PerformanceCounter.NextValue() was by far the biggest contributor to CPU time, and put two and two together to make five.

I ran the app for a few minutes, rather than the one minute I originally tested with, and the stats inverted. Chart.SaveImage() was overwhelmingly responsible for CPU consumption, with the calling method, Agent.Graph(), taking up ~71% of samples.

Schoolboy misinterpretation, but as always a bit of thought and investigation soon shows up the problem.

Now. Why is Chart.SaveImage() so expensive, and is there a cheaper alternative?

Thursday, 12 April 2012

C# performance counters impact performance?

I’ve been using System.Diagnostics.PerformanceCounter to get at CPU and memory usage stats – but it looks like whenever I call NextValue it spikes CPU usage. Running my app through the VS profiler points straight at NextValue as the main CPU load.

It looks, then, like querying PerformanceCounter.Next value seriously impacts CPU usage – on my dual core laptop it flipflops between 5 and 10% utilization.

I’m pretty sure that the same thing doesn’t happen when you use ProcessExplorer, or TaskManager, or Perfmon. I’ve been trying to work out a native way of getting at the same data, but it’s been surprisingly difficult. I just found these that look like decent leads:

SO question on logging performance metrics

Logman -- command line perfmon use

Writing performance data to a log file

Wednesday, 11 April 2012

Creating a chart programmatically in C# using DataVisualization.Charting

Means you have to reference System.Windows.Forms and System.Windows.Forms.DataVisualization, even though you might be doing this in a console application. That said, it also includes a set of data manipulation functions, some of which are even finance-specific:

using System;
using System.Drawing;
using System.Windows.Forms.DataVisualization.Charting;

namespace Sandbox
{
    class Program
    {
        static void Main(string[] args)
        {
            // set up some data
            var xvals = new[]
                {
                    new DateTime(2012, 4, 4), 
                    new DateTime(2012, 4, 5), 
                    new DateTime(2012, 4, 6), 
                    new DateTime(2012, 4, 7)
                };
            var yvals = new[] { 1,3,7,12 };

            // create the chart
            var chart = new Chart();
            chart.Size = new Size(600, 250);

            var chartArea = new ChartArea();
            chartArea.AxisX.LabelStyle.Format = "dd/MMM\nhh:mm";
            chartArea.AxisX.MajorGrid.LineColor = Color.LightGray;
            chartArea.AxisY.MajorGrid.LineColor = Color.LightGray;
            chartArea.AxisX.LabelStyle.Font = new Font("Consolas", 8);
            chartArea.AxisY.LabelStyle.Font = new Font("Consolas", 8);
            chart.ChartAreas.Add(chartArea);

            var series = new Series();
            series.Name = "Series1";
            series.ChartType = SeriesChartType.FastLine;
            series.XValueType = ChartValueType.DateTime;
            chart.Series.Add(series);

            // bind the datapoints
            chart.Series["Series1"].Points.DataBindXY(xvals, yvals);

            // copy the series and manipulate the copy
            chart.DataManipulator.CopySeriesValues("Series1", "Series2");
            chart.DataManipulator.FinancialFormula(
                FinancialFormula.WeightedMovingAverage, 
                "Series2"
            );
            chart.Series["Series2"].ChartType = SeriesChartType.FastLine;

            // draw!
            chart.Invalidate();

            // write out a file
            chart.SaveImage("chart.png", ChartImageFormat.Png);
        }
    }
}

Gives the following result:

chart

Wednesday, 14 March 2012

RRDTool, and C# .NET bindings

RRDTool is pretty much ubiquitous in Linux/Unix cluster environments – or at least, it is in those I’ve worked with. It provides simple but highly reliable round-robin database services into which you can dump pretty much any metric you like. It’ll keep a running dataset at the granularity and duration you define; enable you to export data in chart and xml form; and even perform some useful analysis.

These days I’m typically working in Windows environment, and typically most clients I work for need some sort of dashboard to aggregate information about their clusters and grids. For a long time RRDTool was a pain to build on Windows, and there was no single .NET wrapper. The front runner – NHawk – actually spawned rrdtool processes rather than wrapping the underlying libs direct.

Now it turns out that someone’s contributed .NET bindings to the trunk of RRDTool. I figured I’d see if I could get it working, on 64bit Win7 (although actually x86 is fine for my app), under Visual Studio 2010.

I checked trunk out from SVN and took a look.

The first thing is to set up the dependencies – I tried to take a short cut and begin with a GTK+ package, but found it’s best to start with the files mentioned explicitly in the WIN32_BUILD_TIPS file.

There were a few apparently non-serious build errors in the rrdlib project. In several places explicit casts from void* were required on malloc, realloc. Also, there was some skipping of variable initialization in switch statements – latter can be fixed just by enclosing in a block.

Running through the tutorial with rrdtutorial raised one problem – an error claiming “No positional legend found”. The error was generated in rrd_graph_helper.c. The log showed that this was a work in progress, so I updated to the preceding version, built and it worked apparently fine.

After that I built the .NET bindings – basically fine, although I wrangled everything to x86 in the end just to get started. But then – nothing was being exported. There’s a .def file in the lib solution, but it doesn’t appear to exist any more. So: I wrapped a copy of the public method declarations in #ifdef WIN32, and prefixed with __declspec(dllexport), then rebuilt the .NET binding solution and: success.

All looks good to go. Next step is to grab metrics from windows performance counters in a C# app and see what I can present through RRDTool.

Friday, 2 December 2011

Out (and ref) parameters in Actions, Funcs, delegates and lambdas

I ran into a couple of wrinkles I wasn’t aware of before when coding up a facade for the ThreadPool for tests today, along the lines of the Path, Directory etc facades I’ve done before.

I wanted to insert a replacement ThreadPool so I could test the GetAvailableThreads method, which takes two out parameters.

You can’t quite specify the lambda as you might expect for the method implementation. This initial attempt, for example, doesn’t work:

public static class ThreadPool
{
    public static Action<int, int> GetAvailableThreadsImpl =
        System.Threading.ThreadPool.GetAvailableThreads;

    public static void GetAvailableThreads(out int workerThreads, out int ioThreads)
    {
        GetAvailableThreadsImpl(out workerThreads, out ioThreads);
    }
}

I suspect this is to do with the calling style here -- but need to understand why it happens in more detail. You can work around it by just creating your own delegate class:

public delegate void GetAvailableThreadsDel(out int x, out int y);
 
public static class ThreadPool
{
    public static GetAvailableThreadsDel GetAvailableThreadsImpl =
        System.Threading.ThreadPool.GetAvailableThreads;

    public static void GetAvailableThreads(out int workerThreads, out int ioThreads)
    {
        GetAvailableThreadsImpl(out workerThreads, out ioThreads);
    }
}

Then follows a small wrinkle when defining a replacement behaviour in your test. You can, of course, create your own method with the right signature:

[Test]
public void Blah()
{
    int callCount = 0;
    ThreadPool.GetAvailableThreadsImpl = GetAvailableThreadsStub;
}

private int callCount = 0;
private void GetAvailableThreadsStub(out int x, out int y)
{
    if (callCount == 0)
    {
        x = 5;
        y = 5;
    }
    else
    {
        x = 10;
        y = 10;
    }

    callCount++;
}

It turns out you can define out parameters in a lambda however -- but you must also explicitly state the parameter type as well, unlike normal:

[Test]
public void Blah()
{
    int callCount = 0;
    ThreadPool.GetAvailableThreadsImpl = (out int x, out int y) =>
        {
            if (callCount == 0)
            {
                x = 5;
                y = 5;
            }
            else
            {
                x = 10;
                y = 10;
            }

            callCount++;
        };
    }
}
Again, I'm not entirely sure how it works here, and need to investigate further. For now, just a wrinkle to remember.

Sunday, 16 October 2011

Wiping the state clean: static stateful classes in NUnit tests

I’m automating some tests that are currently run manually in a batch script that spins up the same executable multiple times, with varying options. As always, I’d like to get the tests started without modifying existing code, and preferably without adding any new code.

Unfortunately the application poses a few problems. The entry class has a curiously-implemented singleton behaviour to ensure that only one is running in a process. It also keeps a static ref to a set of command line options, but doesn’t give the client any way of clearing those options to restart processing. I also need to inject some behaviour that would allow the test to sense that the correct thing had been done. The class looks a bit like this:

namespace AppDomainInNUnit
{
    internal class BaseApplication
    {
        public static BaseApplication Instance = null;

        public BaseApplication()
        {
            if(Instance == null)
            {
                Instance = this;
            }
            else
            {
                throw new InvalidOperationException("ctor fail");
            }
    }

    class Application : BaseApplication
    {
        static int Main(string[] args)
        {
            var app = new Application();
            return app.Run();
        }

        int Run()
        {
            _options.Add("option", "added");
            foreach(var option in _options.Keys)
                Console.WriteLine("{0} {1}", option, _options[option]);
            return 0;
        }

        public static Action<string> PostFinalStatus = s => Console.WriteLine(s);

        private static readonly Dictionary<string, string> _options = new Dictionary<string, string>();
    }
}

I could add methods to the existing code to clear the options and to handle the singleton behaviour, but that means changes. In principle there’s no need, as I can instantiate the classes I need in a separate AppDomain, and unload that AppDomain (and dump any static state) when I’m done.

To get this under test I need to do several things. First, I need to create a facade for the Application class that can be marshalled across AppDomain boundaries. Second, I need to consistently create and unload AppDomains in NUnit tests – I want to unload at the end of each test to dump the class’ static state. Finally, I want to inject some behaviour for the PostFinalStatus delegate that will allow the test to sense the state posted by the class.

So, first I need a facade for Application. This is partly because I need to create a class that can be marshalled across AppDomain boundaries. To use marshal-by-reference semantics, and have the instance execute in the new AppDomain, it’ll need to inherit MarshalByRefObject. Unfortunately I need to break the no-changes constraint, and add an internal hook to allow the facade to kick the Application class off.

The TestMain bootstrap class is a basically a copy of the existing Main( … ):

        internal static int TestMain(string[] args)
        {
            return Main(args);
        }

Then I have a simple Facade:

    public class Facade : MarshalByRefObject
    {
        public Facade()
        {
            Console.WriteLine("Facade default ctor in {0}", 
                        Thread.GetDomain().FriendlyName);
        }

        public void Run(string[] args)
        {
            Console.WriteLine("Calling to {0}.", 
                        Thread.GetDomain().FriendlyName);
            
            Application.TestMain(args);
        }
    }

Creating an AppDomain in an NUnit test is fairly straightforward, although it confused me for a while until I realised that the tests are run under a different application – in my case either the JetBrains TestRunner, or nunit-console. In either case the code is not actually available under the executable’s application base directory. The solution is to explicitly set the application base directory for the new test AppDomain:

        [Test]
        public void Test()
        {
            var callingDomain = Thread.GetDomain();
            var callingDomainName = callingDomain.FriendlyName;
            
            Console.WriteLine("{0}\n{1}\n{2}", 
                callingDomainName, 
                callingDomain.SetupInformation.ApplicationBase, 
                callingDomain.SetupInformation.PrivateBinPath);

            var domain = AppDomain.CreateDomain("test-domain", null, null);
            
            Console.WriteLine("{0}\n{1}\n{2}", 
                domain.FriendlyName, 
                domain.SetupInformation.ApplicationBase, 
                domain.SetupInformation.PrivateBinPath);
            
            AppDomain.Unload(domain);

            var setup = new AppDomainSetup() { 
                ApplicationBase = callingDomain.SetupInformation.ApplicationBase };
            
            domain = AppDomain.CreateDomain("test-domain", null, setup);
            
            Console.WriteLine("{0}\n{1}\n{2}", 
                domain.FriendlyName, 
                domain.SetupInformation.ApplicationBase, 
                domain.SetupInformation.PrivateBinPath);

            var assembly = Assembly.GetExecutingAssembly().CodeBase;

            var facade = domain.CreateInstanceFromAndUnwrap(
                assembly, 
                "AppDomainInNUnit.Facade") as Facade;
            
            facade.Run(new [] { "some", "args" });

            AppDomain.Unload(domain);
        }

There’s a lot of cruft in there, but the intent is to show which AppDomain the class is actually being instantiated in, for clarity.

Finally, I want my tests to be informed of the Application’s final status when it posts it. This is tricky; I’ve been able to do it by passing in a delegate that sets some property data on the test AppDomain, then querying the AppDomain property data during the test assert stage. First the facade needs a method that allows me to set the post behaviour for Application:

        public void SetPostBehaviour(Action<string> behaviour)
        {
            Application.PostFinalStatus = behaviour;
        }

Then I need to pass a delegate with the right behaviour in during the test, and assert on the value of that data before unloading the test AppDomain:

            ...
            var assembly = Assembly.GetExecutingAssembly().CodeBase;

            var facade = domain.CreateInstanceFromAndUnwrap(
                assembly, 
                "AppDomainInNUnit.Facade") as Facade;
            
            var posted = false;
            facade.SetPostBehaviour(s => Thread.GetDomain().SetData("posted", true));
            
            facade.Run(new [] { "some", "args" });

            Assert.IsTrue((bool)domain.GetData("posted"));
            ...

So, it's possible to work around these static classes without too many intrusive changes to the existing code. Generally:

  1. To instantiate and execute a class in another AppDomain the class should derive from MarshalByRefObject (see Richter, CLR via C#). You’ll get a proxy to the instance in the new domain.
  2. Don’t tag with Serializable instead of deriving from MarshalByRefObject – you’ll get a copy of the instance in the other domain, and will still run in the original domain.
  3. You can, but you shouldn’t invoke static methods or fields on your class that derives from MarshalRefByObject. It won’t give you the effect you expect: all static calls are made in the calling domain, not the separate domain. To make calls on static methods you need to create a facade or adapter that can be marshalled across the domain boundary, and have that make the static calls for you.
  4. In the various CreateInstance… methods on AppDomain remember to use a fully qualified type name for the class you want to instantiate. This generally isn’t clear from examples like that in Richter, who dump all their classes in the global namespace (tsk).
  5. If you’re creating an AppDomain in an NUnit test, remember that you might need to set the ApplicationBase for the domain to the directory holding your test code.
  6. I wanted to get AppDomain.ExecuteAssembly(string, string[]) working, which would mean that I wouldn’t need a TestMain hook in the existing code. I’ve not managed to get it working yet, though. In any event, I’d still need a facade that I could marshal across the boundary in order to set the status post behaviour.

Saturday, 8 October 2011

Preventing inadvertent changes to static classes

This is a followup to these posts, where I developed a way of opening up a seam along filesystem access in C#.

The last post highlighted a problem with the approach: when behaviour is changed by injecting a new delegate it is changed for all subsequent users of the class.

This is a small problem in tests – you just need to make sure that you reset your static class state in test setup and tear down.

In a production system however it could be a much larger problem. A developer could change the behaviour of the class without realising the consequences, and change the behaviour of the system in an unexpected way. Equally, they could deliberately subvert the behaviour of the system – but if they’re going to do that, they’d probably find a better way of doing it.

You could avoid this by treating this technique as only a short term measure to open a seam while refactoring legacy code, and rapidly refactor again to something more robust, perhaps using a factory or IOC container to inject different implementations for test or production code. This is entirely reasonable; the technique gets very quick and easy results, and you could definitely use it while characterizing legacy code and rapidly refactor away from it.

Alternatively you could make it somewhat lockable, and have it warn if code tries to change behaviour without. I’m musing now, because I tend to think about this technique in the sense I’ve just described. In principle though you could guard against careless changes in behaviour by having the class “locked” by default, and only allow changes to behaviour after first unlocking the class.

Tangentially this raises a question – is a physical lock a form of security by obfuscation and awkwardness?

To give an example, consider this test code for a notional File class:

    [TestFixture]
    public class FileTests
    {
        [SetUp]
        public void SetUp()
        {
            File.Unlock();
            File.CopyImpl = null;
            File.Lock();
        }

        [Test]
        [ExpectedException("System.InvalidOperationException")]
        public void File_ShouldWarn_IfBehaviourChangesWhenLocked()
        {
            File.CopyImpl = null;
        }

        [Test]
        public void File_ShouldAllow_BehaviourChangeWhenUnlocked()
        {
            File.Unlock();
            File.CopyImpl = (src, dst, ovrt) => { };
        }
    }

I don't see the lock as a strong lock -- just a flag to make a developer stop and think about what they're doing, and to allow a mechanism to raise an alert if it's done without thought. An implementation that matches these tests could look like:

    public static class File
    {
        private static Action<string, string, bool> _copyImpl = System.IO.File.Copy;

        private static bool _locked = true;

        public static Action<string, string, bool> CopyImpl
        {
            get
            {
                return _copyImpl;
            }
            set
            {
                if(_locked)
                {
                    throw new InvalidOperationException("IO.Abstractions.File is locked to disallow behaviour changes");
                }
                _copyImpl = value;
            }
        }

        public static void Unlock()
        {
            Trace.WriteLine("IO.Abstractions.File now unlocked for behaviour changes");
            _locked = false;
        }

        public static void Lock()
        {
            Trace.WriteLine("IO.Abstractions.File now locked for behaviour changes");
            _locked = true;            
        }

        public static void Copy(string source, string destination, bool overwrite)
        {
            CopyImpl(source, destination, overwrite);
        }
    }

The underlying implementation is the same as I presented before, with a couple of changes. There are now obvious Lock and Unlock methods; I'm using these to just set or unset an internal flag. I'm wrapping the point of injection of new behaviour for CopyImpl in a property, and using the set method to check the locking status. If the class is locked, it'll throw an exception to indicate that you're not meant to be changing it. The class is locked by default.

Exactly how useful this is in the long term I'm not sure. It's tempting to keep the Abstractions in place, as the class structure is simpler than the normal interface-and-factory style approach that you might use out of choice. It's possible that an IOC container might be abused in the same way as this technique, by a developer who wants a specific local behaviour but doesn't understand that their changes might have global consequences.

And I've not even touched on any possible threading problems.

Friday, 7 October 2011

Using static classes in tests

This is a followup from my previous post on mocking out static classes and injecting behaviour.

The disadvantage to injecting test specific behaviour into a static class is that if you’re not careful you can leak behaviour from test to test. This certainly happens in NUnit, in which a static class will be instantiated once for a test session – not once per test instance.

Take these psuedo-tests for example:

[Test]
public void FirstTest()
{
    IO.Abstractions.Path.CombineImpl = (path1, path2) => "some\\default\\path";

    Assert.AreEqual("some\\default\\path", IO.Abstractions.Path.Combine("some", "path"));
}

[Test]
public void SecondTest()
{
    // assume we're using the default implementation -- System.IO.Path.Combine

    Assert.AreEqual("some\\path", IO.Abstractions.Path.Combine("some", "path"));
}

FirstTest will succeed. If FirstTest runs first, then SecondTest will fail; if SecondTest runs first, SecondTest will succeed. the problem is that FirstTest sets the behaviour for Path.Combine and SecondTest doesn't override it.

The trick is to ensure you reset the behaviour in test setup and teardown. You can just reset to default behaviour in either:

[SetUp}
public void SetUp()
{
    IO.Abstractions.Path.CombineImpl = System.IO.Path.Combine;
}

or you might want to set the behaviour to null, and just set the defaults on teardown:

[SetUp}
public void SetUp()
{
    IO.Abstractions.Path.CombineImpl = null;
}

[TearDown}
public void TearDown()
{
    IO.Abstractions.Path.CombineImpl = System.IO.Path.Combine;
}

This latter approach has the advantage that -- if you null out all possible behaviour across the static classes used -- you immediately get to sense which methods are being hit in any given test, and where in the code under test it's being hit from.