Showing posts with label data. Show all posts

Wednesday, 30 September 2015

Handling Redis messages in parallel

In the last post it looked like the rate of submission and completion of tasks was constant in time, but that the rate of completion of workflows was not.

There are two end member scenarios: if tasks were completed in strict workflow order then there’d be a steady progression of workflows completing, giving a constant rate; alternatively, if the first 8 tasks in every workflow were completed first, and the last task only started when every other workflow had been touched, then all workflows would complete almost instantaneously right at the end of the run. What I saw in the last results might represent a balance between the two.

The workflow completion behaviour might also be controlled or modified by the messages in flight from Redis, and by the way these are both published and picked up by the client (StackExchange.Redis). I’m assuming that Redis will not stall while it passes a given message to every consumer subscribed, and I’m assuming that StackExchange.Redis will make a separately-threaded callback into my code whenever a message is received, probably subject to some throttling.

There are a couple of things there that I can check. One is the number of running tasks at each moment; if we’re handling these in a multithreaded way (via StackExchange.Redis – there’s no such behaviour in the benchmark app yet) then it should be observable. The other thing to check is the size of the submitted queue.

I added some instrumentation to my benchmark app to output these and, voila:

image

The submitted queue size reaches a plateau then hovers there, which intuitively means that across all workflows we’re finishing one task and replacing it with another in the submitted queue. It tails off roughly in line with the workflow completion curve.

One very interesting point to take away there is that the number of running tasks at any time is 1.

That indicates that somewhere the processing of tasks is either bottlenecked or significantly throttled. I’m not doing anything in my app. Is StackExchange.Redis serializing the handling of the returned messages?

It turns out that it is. By default, StackExchange.Redis forces subscribed message handling to be sequential, principally because it’s safer: it stops clients having to worry about thread conflicts when processing the messages.

However, when you want to scale out it makes sense to let go and account for possible threading issues by design. In this case, each workflow task is intended to be a unit independent of any other, and so they’re embarrassingly parallelisable. In fact, currently the creation of the multiplexer is in the hand of the client, so they can make the choice themselves.

If I set ConnectionMultiplexer.PreserveAsyncOrder = false in the benchmark app, things improve considerably. Task churn leaps to 4k per second; the whole run completes sooner (210 seconds) with the push only finishing at 168 seconds.

benchmark-2

There’s a lot less dispersion in the message handling – the workflow complete queues are much tighter, and the count of tasks completing follows the submitted count much more closely. After a suppressed start the system completes workflows at a steady rate.

For the bulk of the run task submission and completion, and workflow completion, proceed at a constant rate. That indicates that this solution might scale out with an increasing number of tasks or workflows.

It’s not all sunshine and rainbows. When repeated I’ve seen occasional timeouts which currently bring the workflows down. Superficially they seem to be correlated with the points at which Redis forks and saves out its logs – typically I see error messages like

Timeout performing EVAL, inst: 1, mgr: ExecuteSelect, err: never, queue: 22, qu: 0, qs: 22, qc: 0, wr: 0, wq: 0, in: 0, ar: 0, IOCP: (Busy=0,Free=1000,Min=4,Max=1000), WORKER: (Busy=20,Free=2027,Min=4,Max=2047), clientName: TIM-LAPTOP

This seems to indicate that 22 commands have been sent to the server (qs), but no response has been received (in); consequently it might worth increasing the timeout. If it is related to the Redis background fork-and-save, perhaps there’s something I can do there too.

Monday, 28 September 2015

First look at performance for workflow processing

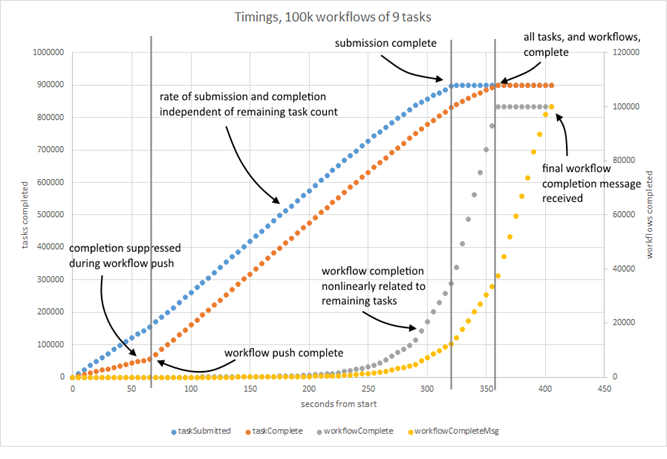
I’ve set up a simple benchmarking app to get a look at how my new Redis-based workflow processing system was going, and used it to create 100k workflows, each containing 9 tasks. The workflow structure is identical for each: just a simple chain. I ran it and a Redis instance on my dev laptop, and gathered data about task submit and completion time, and workflow completion time – both actual, and when I received the Redis pub-sub message to confirm completion.

image

It took ~350 seconds to run through 900k tasks (each as close to a no-op as possible) giving an overall churn around 1k tasks per second. It took ~60 seconds to submit 100k workflows with initial tasks, or about 1.5k workflows per second.

Completion of tasks was noticeably suppressed during workflow submission, and as a result the number of completed tasks lags behind the number of submitted tasks. However, it looks like the rate of task submission and completion – the key parts of workflow turnover – are independent of the number of tasks to run, suggesting that this behaviour scales.

There are some features that I don’t immediately understand, however. The rate of workflow completion is not linear; completion is delayed, as you might expect, but the rate increases with time.

Additionally, there’s a delay between actual workflow completion and the delivery of the message that signals that a workflow has completed. The rate of delivery looks consistent with the rate of completion, but the delay is consistently about 50 seconds. Two things immediately occur to me; as the system’s using message passing to flag submission of new tasks that they might also be affected by a delay; and that arguably we might not need to wait for a message to tell us that a workflow has completed. As I’m marking tasks complete synchronously from the client, it could potentially tell me that there are either more tasks submitted as a result, or none, in which case I could reasonably take some sort of action (although that action would need to be shared across all task handling processes, if I had such).

In fact, there’s a problem with the way I’ve labelled the curves – it’s not obvious that workflow completion time is nonlinearly related to the number of remaining tasks. I’m making an assumption.

Next things to check: I’m going to add a periodic sampling of the queue size to add to this chart, and see if its possible to analyse the number of messages being posted. 

Friday, 13 April 2012

C# performance counters impact performance? No, but it seems that Chart.SaveImage does.

A little thought later and it looks like no, they don’t impact performance. What I was seeing was the effect of prepping and drawing a chart – on about the same timescale that I was querying for information.

Diagnosing the problem was straightforward; I crosschecked the processor usage for the tool with perfmon. After configuring it to avoid saving down a chart the processor usage dropped to zero.

It is a good example of misleading yourself while looking at performance stats. I could see usage spiking on a period that looked suspicious. I used the VS 2010 in-built profiler and saw that PerformanceCounter.NextValue() was by far the biggest contributor to CPU time, and put two and two together to make five.

I ran the app for a few minutes, rather than the one minute I originally tested with, and the stats inverted. Chart.SaveImage() was overwhelmingly responsible for CPU consumption, with the calling method, Agent.Graph(), taking up ~71% of samples.

Schoolboy misinterpretation, but as always a bit of thought and investigation soon shows up the problem.

Now. Why is Chart.SaveImage() so expensive, and is there a cheaper alternative?

Thursday, 12 April 2012

C# performance counters impact performance?

I’ve been using System.Diagnostics.PerformanceCounter to get at CPU and memory usage stats – but it looks like whenever I call NextValue it spikes CPU usage. Running my app through the VS profiler points straight at NextValue as the main CPU load.

It looks, then, like querying PerformanceCounter.Next value seriously impacts CPU usage – on my dual core laptop it flipflops between 5 and 10% utilization.

I’m pretty sure that the same thing doesn’t happen when you use ProcessExplorer, or TaskManager, or Perfmon. I’ve been trying to work out a native way of getting at the same data, but it’s been surprisingly difficult. I just found these that look like decent leads:

SO question on logging performance metrics

Logman -- command line perfmon use

Writing performance data to a log file

Wednesday, 27 July 2011

Constructing a task occupancy time series from discrete task start and end times

When finding my way around a new distributed system I often want to see a chart of the number of tasks running on a system at the same time but only have discrete task start and end time data. Even if time series data already exists, it’s often not broken down in a meaningful way – say by task type, or final status.

So: how do I build a time series like this from a set of discrete start and end times?

I tackle this in three steps. First, I build and sort lists of start and end times. Secondly, I process these two lists to get a task event dataset: every start takes a running count of tasks up, and every end takes it down. Finally I process that event dataset to build a time series based on discrete time points.

Building sorted lists of task start and end times is pretty straightforward. I typically dump start and end time data from the database, which might look like this:

2011-07-19 04:02:45.0730000,2011-07-19 04:03:21.6000000
2011-07-19 04:02:45.0730000,2011-07-19 04:03:44.7030000
2011-07-18 22:58:52.1800000,2011-07-18 22:58:52.6670000
2011-07-18 22:58:53.3500000,2011-07-18 22:58:57.7700000
2011-07-18 22:58:52.1800000,2011-07-18 22:58:52.7200000
2011-07-18 22:58:53.3500000,2011-07-18 22:58:58.4030000
2011-07-18 22:58:52.1800000,2011-07-18 22:58:52.7100000
2011-07-18 22:58:53.3500000,2011-07-18 22:58:57.7700000
2011-07-18 22:58:52.1800000,2011-07-18 22:58:52.7630000
2011-07-18 22:58:53.3500000,2011-07-18 22:58:57.7700000

and then use the excellent FileHelpers library to load them in. I make some assumptions about the data – the earliest start is earlier than the first and point, at least.

After that, sort the lists in place in ascending time order.

var starts = new List<DateTime>();
var ends = new List<DateTime>();
foreach(var task in tasks)
{
	starts.Add(task.start);
	ends.Add(task.end);
}

starts.Sort((a, b) => 
	Convert.ToInt32(new TimeSpan(a.Ticks - b.Ticks).TotalMilliseconds));
ends.Sort((a, b) => 
	Convert.ToInt32(new TimeSpan(a.Ticks - b.Ticks).TotalMilliseconds));

Merging the two lists to create an event dataset is a little trickier. I do it by processing either the start or the end list in order at any time, swapping between them when the timestamps in one jump ahead of the timestamps in the other. I keep a running count of tasks (the occupancy) – every start takes it up, and every end takes it down.

int currentIndex = 0;
int otherIndex = 0;
int runningCount = 0;
var currentList = starts;
var otherList = ends;
var incdec = 1;

var timestamp = new List<DateTime>();
var value = new List<int>();

while (currentIndex < currentList.Count - 1)
{
	runningCount += incdec;
	timestamp.Add(currentList[currentIndex]);
	value.Add(runningCount);

	currentIndex++;
	if (currentList[currentIndex] > otherList[otherIndex])
	{
		var tempIndex = currentIndex;
		currentIndex = otherIndex;
		otherIndex = tempIndex;
		var tempList = currentList;
		currentList = otherList;
		otherList = tempList;

		incdec *= -1;
	}
}

This generates a relative time series, with offsets from the number of tasks running at the start of the dataset. To constrain this I’d need to work out what that initial number of tasks is. Generally I’d count the number of tasks that started but didn’t end before my time series starts.

Finally, create a discrete timeseries with evenly spaced points. I just generate a list of timestamp points and for each take the nearest previous recorded occupancy value. Generally I’ll also take a highwater mark, as otherwise you lose a feel of any peaky behaviour within between points.

var index = 0;
var dt = new TimeSpan(0, 5, 0);
var current = timestamp[0];

while (current < timestamp[timestamp.Count - 2])
{
	var next = current.AddTicks(dt.Ticks);

	var highwater = 0;
	while (index < timestamp.Count - 1 
		&& timestamp[index + 1] < next)
	{
		index++;
		if (highwater < value[index]) 
			highwater = value[index];
	}

	Console.WriteLine(current + "\t" + value[index] + "\t" + highwater);
	current = next;
}

You’ll notice this is quite loose; I’m not really worrying about interpolating to get values at exact time series points, and so on.

And that’s basically it. When building your series you can fold in extra information – about the task type for example – and use that to show how the system treats different task types.